



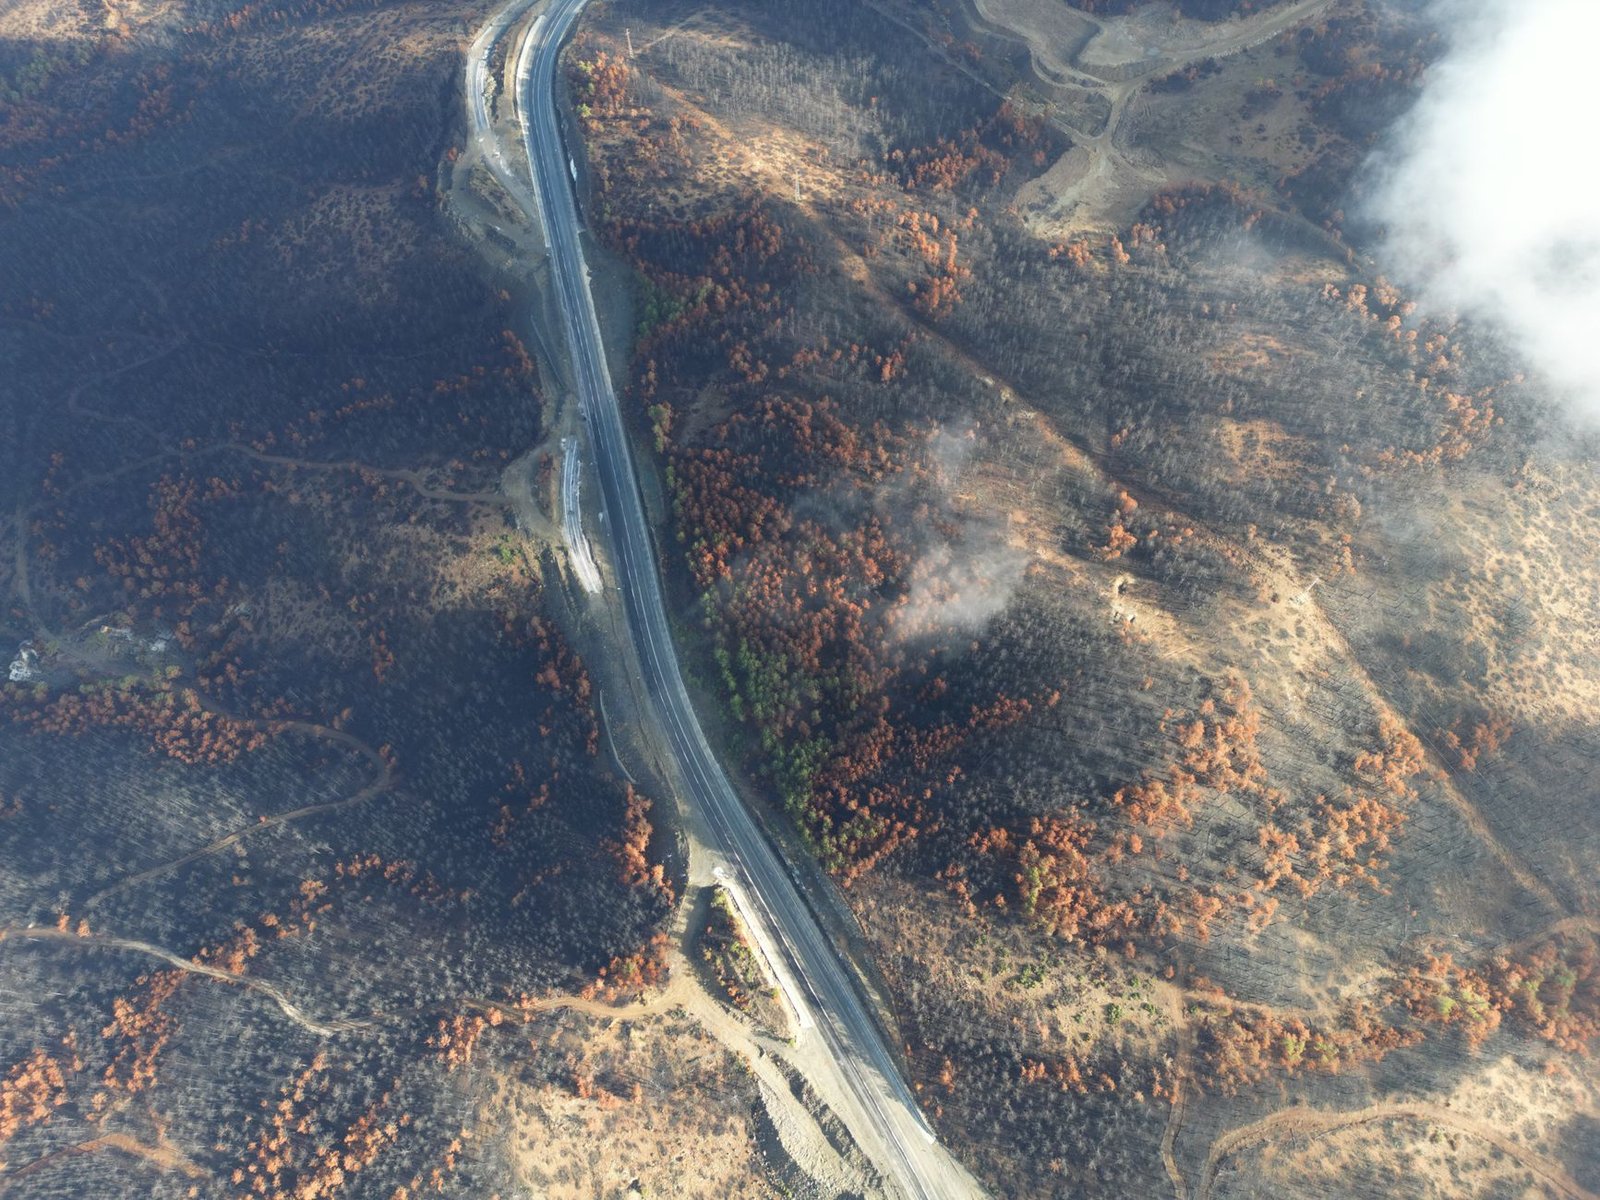
Imagine being able to track wildfires from a coffee shop anywhere in the world using free satellite imagery. Thanks to Europe’s enhanced satellite services, this dream is now a reality, combining cutting-edge technology with crucial environmental management tools.
Key Takeaways
- Europe’s satellite service has made wildfire tracking more accessible to the public.
- The Copernicus Browser is a free tool offering detailed satellite imagery from Sentinel satellites.
- Sentinel-2 satellites provide high-resolution multi-spectral images that are essential for monitoring wildfires.
- A new “wildfires” layer simplifies the visualization of active fires and damaged areas.
- This development underscores the importance of tech innovation in environmental conservation.
Understanding Europe’s Satellite Service
The **Copernicus Browser** is an essential part of the European Union’s Earth observation program. This comprehensive tool gives anyone free access to satellite imagery captured by the **Sentinel satellites**, a fleet operated by the European Space Agency. Designed to observe the Earth, these satellites provide crucial data to monitor various environmental factors, including wildfires.
Introducing Multi-Spectral Imaging
Among these satellites, the Sentinel-2 mission stands out due to its use of **multi-spectral imaging**. Multi-spectral imaging involves capturing image data within specific wavelength ranges across the electromagnetic spectrum. For Sentinel-2, this means using bands of visible light and **near-infrared**—which are particularly effective for observing the Earth’s surface. These images can offer resolutions as fine as 10 meters, providing detailed insights into land conditions.
A User-Friendly Visualization Layer
Originally, the Copernicus Browser included ten default visualization layers to interpret satellite data, leveraging different spectral bands. On August 4, a new, more intuitive “wildfires” visualization layer was introduced. This layer simplifies the identification of fire-affected areas, allowing users to spot **active fires**, **burning vegetation**, and **scorched landscapes** easily.
Breaking Down the Visualization
With the new layer, various colors represent different elements of a wildfire. **White or yellow hues** indicate active fires, where heat and flames are prevalent. **Red shades** denote burning vegetation, showing where the fire is spreading, while **dark brown or black areas** highlight land that has already been burned. This color-coded system makes it significantly easier for professionals and enthusiasts alike to track and understand wildfire evolution from afar.
The Real-World Impact
To conceptualize the significance of this development, think of it as providing a “bird’s-eye view” of wildfires without needing sophisticated equipment or in-depth technical knowledge. For instance, a firefighter in Spain can use the Copernicus Browser to gain immediate insights into a developing fire, aiding strategic planning and resource allocation.
Staying Ahead with Technology
This innovation not only democratizes access to critical environmental data but also serves as a pivotal tool for researchers, policymakers, and on-ground responders. By streamlining the process of wildfire monitoring, the Copernicus Browser empowers communities and governments to react more swiftly and effectively, potentially mitigating the devastating impacts of wildfires.
The Future of AI and Environmental Management
This advancement represents a significant step forward in using technology for environmental sustainability. As AI continues to evolve, it will undoubtedly enhance these satellite services, enabling more precise predictions and faster, more efficient responses. The integration of AI could lead to even smarter solutions in detecting, monitoring, and combating natural disasters, promising a future where human ingenuity and machine intelligence might work hand-in-hand to protect our planet.
